


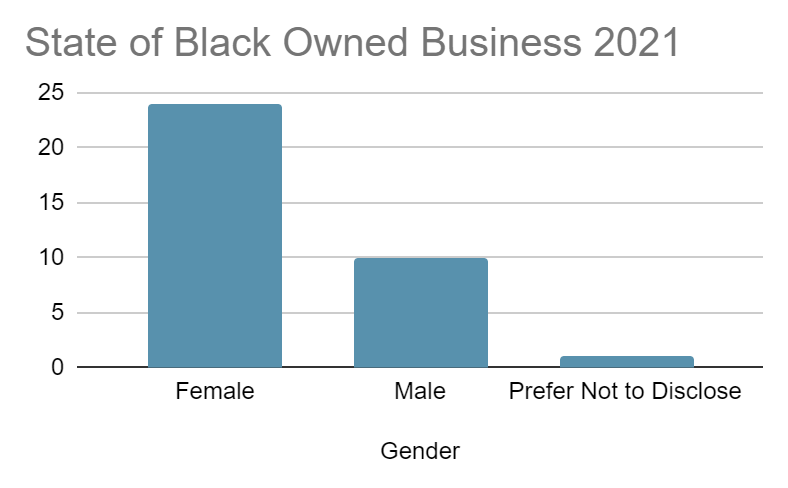

State of Black Owned Business 2021 |
|
| Gender of Attendees | No. of Attendees |
| Female | 24 |
| Male | 10 |
| Prefer Not to Disclose | 1 |
| Total in Attendance | 35 |
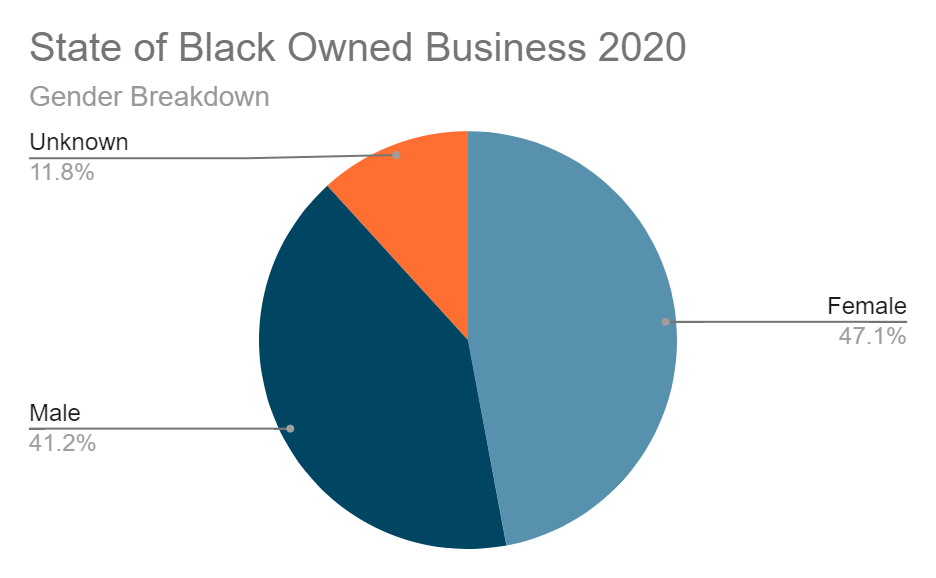
State of Black Owned Business 2020 |
|
| Gender Breakdown | No. of Attendees |
| Female | 8 |
| Male | 7 |
| Unknown | 2 |
| Total in Attendance | 17 |
State of Black Owned Business 2021 | ||
| Groups in Attendance | Number in Attendance | Percentage |
| Business Owner | 20 | 55% |
| Community Member | 5 | 13.00% |
| Faith Based | 3 | 8% |
| Government | 2 | 7% |
| Non Profit | 7 | 17% |
| Totals | 37 | 100% |
We use cookies to improve your experience on our site. By using our site, you consent to cookies.
Manage your cookie preferences below:
Essential cookies enable basic functions and are necessary for the proper function of the website.
These cookies are needed for adding comments on this website.